
Nano Banana Infographic Generator
Turn a topic, source text, process, or small dataset into a polished visual with Nano Banana Pro. Specify the exact wording, hierarchy, format, audience, and style to create readable infographics, flowcharts, comparison graphics, and knowledge cards in one workflow.
Example results — your generated image will appear here
Nano Banana Infographic Prompts and Examples
Copy a structured prompt for a process, dashboard, educational explainer, or comparison. Replace the sample content while keeping the layout and text constraints.
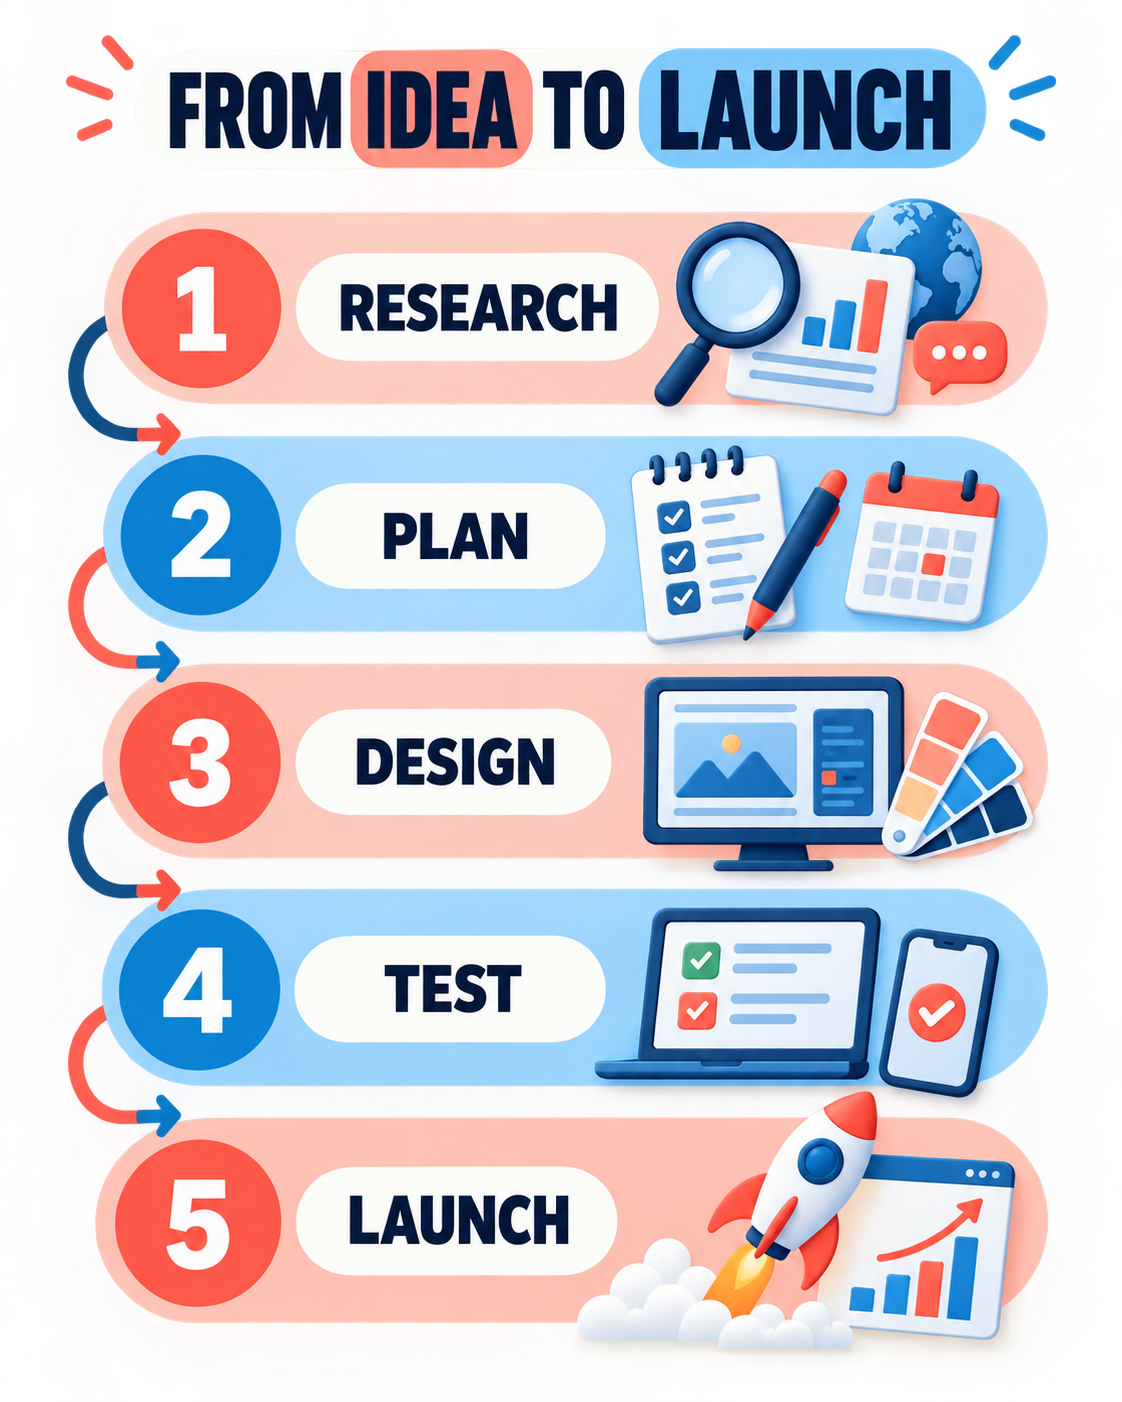
“Create a vertical 4:5 process infographic titled ‘FROM IDEA TO LAUNCH.’ Show exactly five connected stages in this order: 1 RESEARCH, 2 PLAN, 3 DESIGN, 4 TEST, 5 LAUNCH. Give each stage one clear icon, a large number, and a directional connector. Use a cream background, deep navy typography, coral and sky-blue accents, generous margins, and strong thumbnail readability. Render only the supplied text exactly. No tiny copy, logos, watermark, mockup frame, or gibberish.”
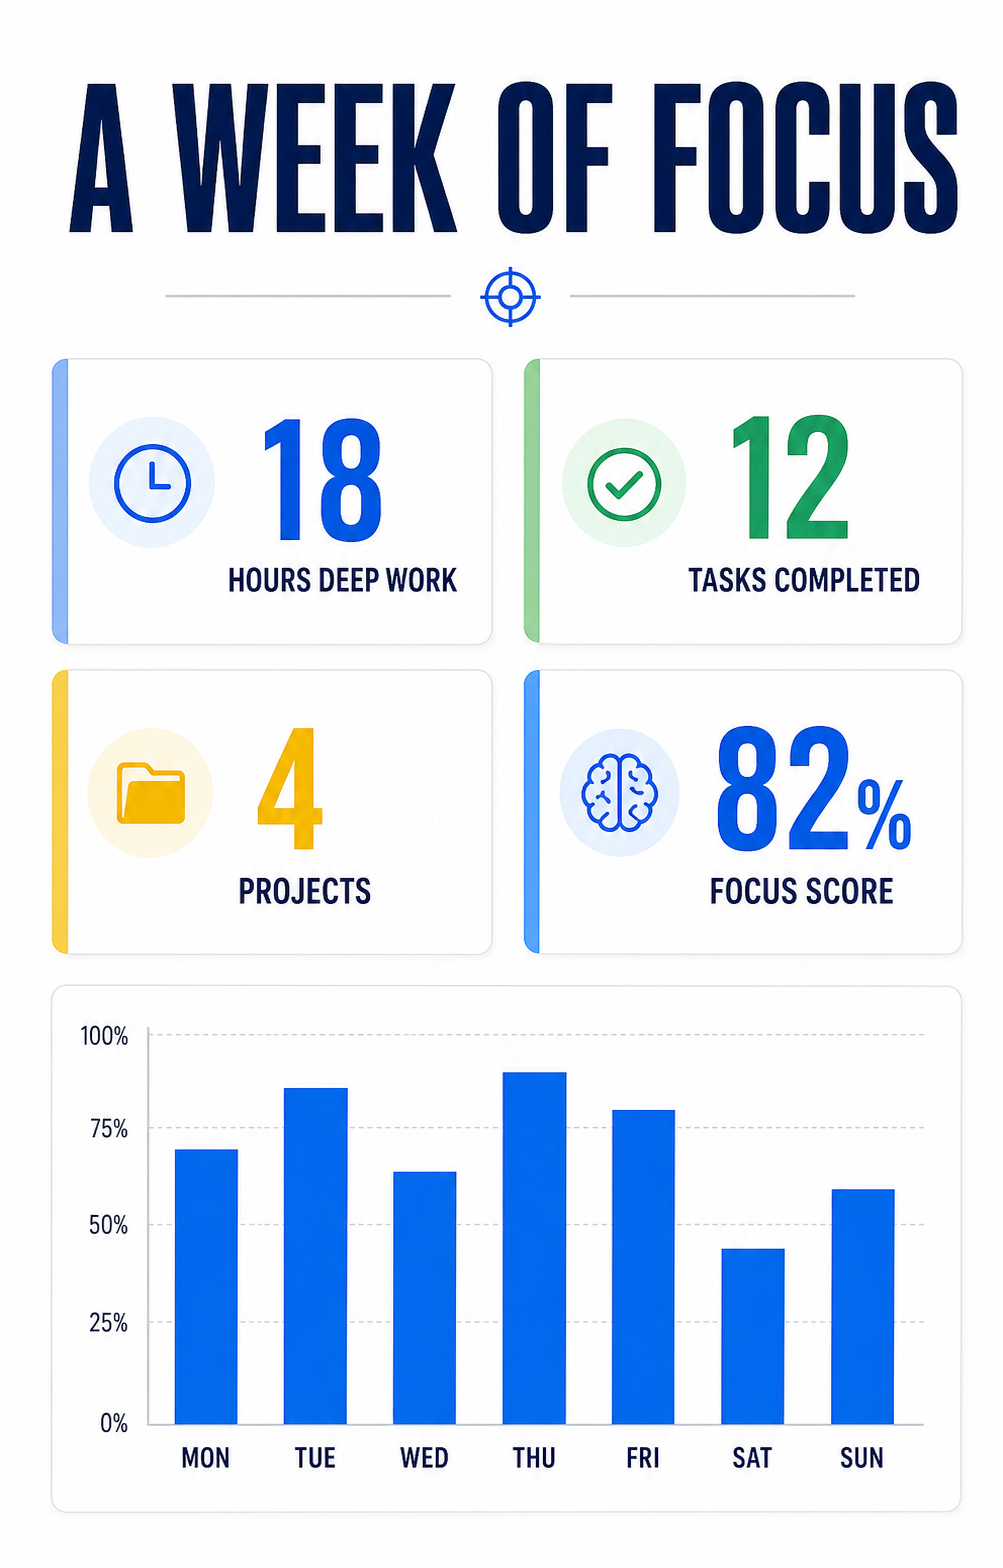
“Design a vertical 4:5 data infographic titled ‘A WEEK OF FOCUS.’ Include four metric cards with exactly: 18 HOURS DEEP WORK, 12 TASKS COMPLETED, 4 PROJECTS, and 82% FOCUS SCORE. Add a seven-bar chart labeled MON, TUE, WED, THU, FRI, SAT, SUN. Use white and pale-gray surfaces with cobalt, emerald, and warm-yellow accents. Keep the data hierarchy obvious and every label readable. No other text, logos, watermark, or decorative numbers.”
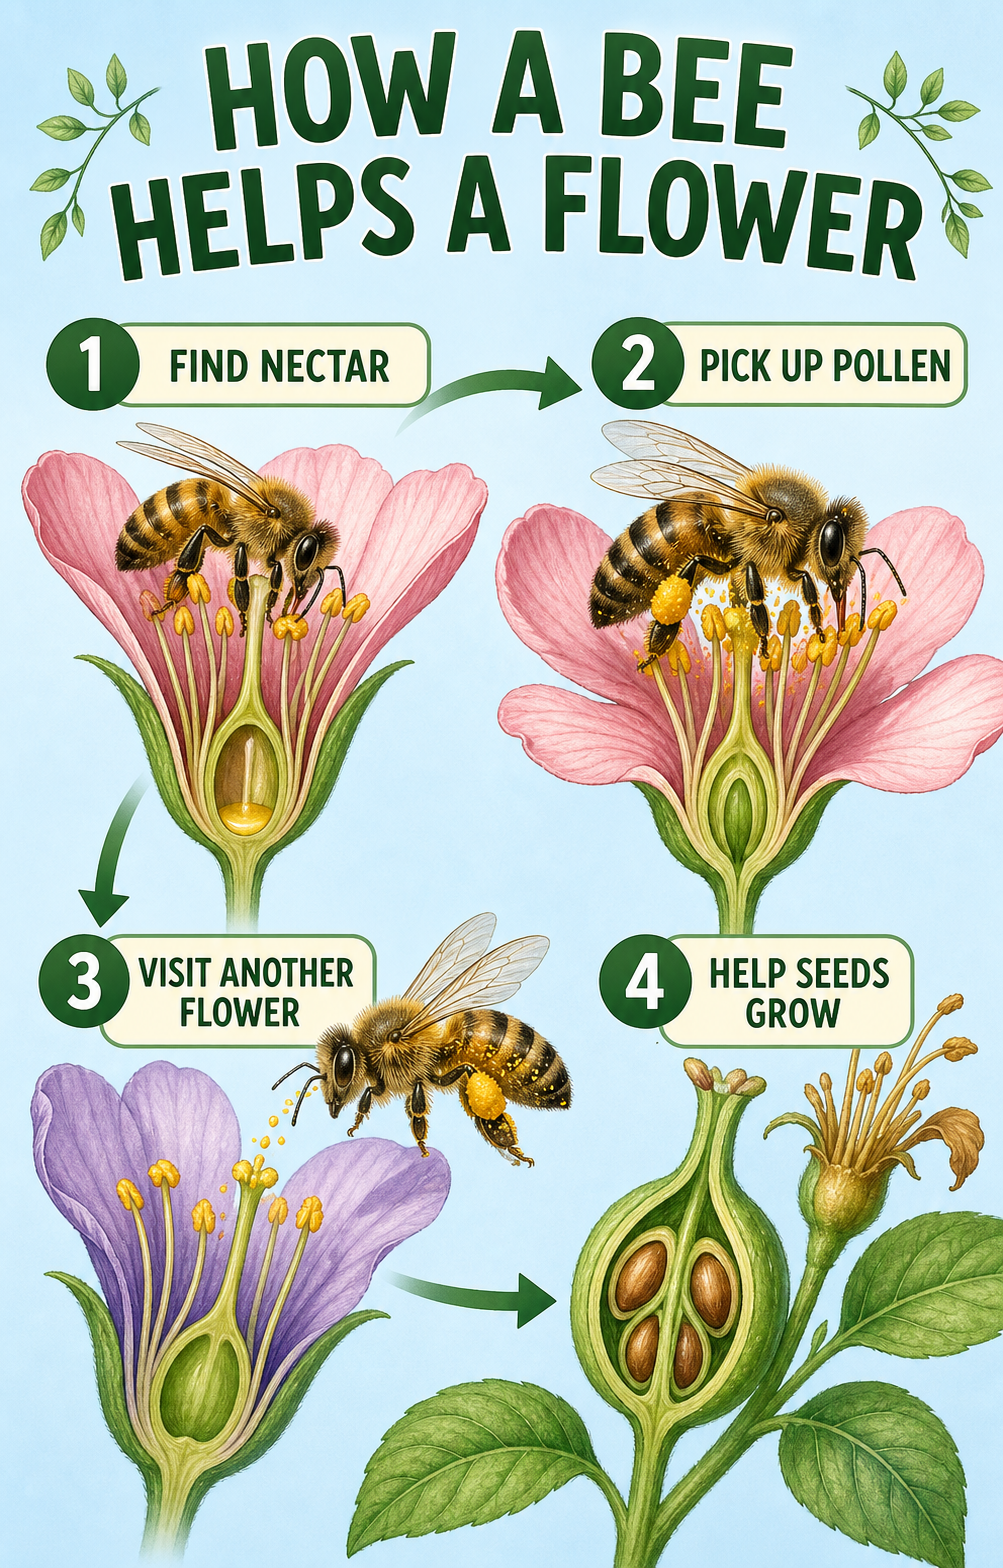
“Create a vertical 4:5 educational infographic titled ‘HOW A BEE HELPS A FLOWER.’ Explain pollination in exactly four illustrated steps: 1 FIND NECTAR, 2 PICK UP POLLEN, 3 VISIT ANOTHER FLOWER, 4 HELP SEEDS GROW. Use biologically plausible bee and flower illustrations, clear green arrows, large classroom-friendly labels, natural flower colors, and a pale-blue background. Render only the exact supplied text. No logos, watermark, tiny notes, or invented labels.”
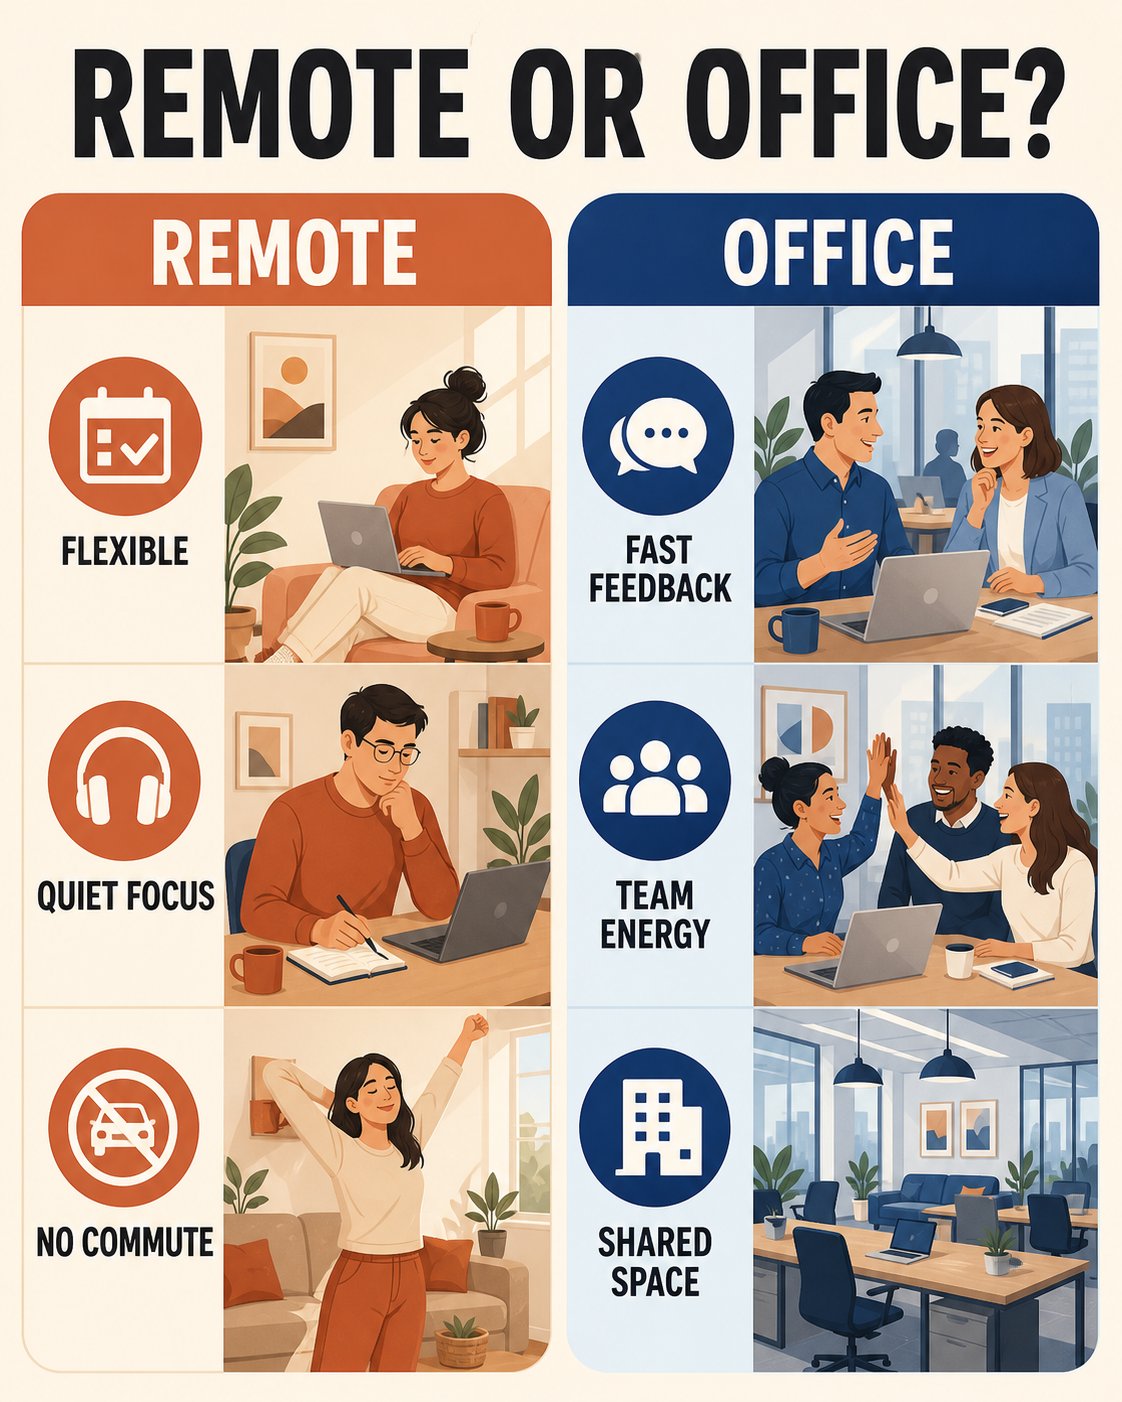
“Create a vertical 4:5 comparison infographic titled ‘REMOTE OR OFFICE?’ Use two balanced columns. Under REMOTE show exactly FLEXIBLE, QUIET FOCUS, and NO COMMUTE. Under OFFICE show exactly FAST FEEDBACK, TEAM ENERGY, and SHARED SPACE. Pair each point with a simple human-centered illustration and icon. Use warm terracotta and cream for remote, indigo and pale blue for office, and dark neutral text. Keep the comparison neutral. No extra text, logos, watermark, or mockup frame.”
How to Make an Infographic with Nano Banana Pro
Treat the prompt as a compact design brief: supply the facts, define the reading order, and state exactly what the image may display.
Add Your Source Content
Enter a topic, paste approved text, summarize a process, or provide a small verified dataset.
Separate headlines, labels, values, and supporting facts before you generate.
Check names, numbers, units, dates, and claims against the original source.
Describe the Visual System
Choose a format and define audience, aspect ratio, reading order, palette, illustration style, and information density.
Quote every required label and ask the model to render it exactly.
Limit sections and text so the result remains legible at its final display size.
Generate and Verify
Review the full-size output before publishing, then refine one issue at a time.
Inspect spelling, data, chart scales, sequence, arrows, icons, and visual emphasis.
Regenerate or edit any misleading detail instead of treating the first output as final.
Build Clear Visual Stories from Dense Information
Nano Banana Pro combines illustration, layout, and in-image text rendering so one prompt can define both the message and its visual structure.
Readable Text Hierarchy
Direct headlines, labels, values, and captions with explicit wording and a clear hierarchy instead of leaving the model to invent copy.
Processes and Relationships
Turn ordered steps, systems, funnels, cycles, and decision paths into connected diagrams with purposeful arrows and groupings.
Data-Led Layouts
Present a small verified dataset as metric cards, comparisons, timelines, or simple charts with units and categories kept visible.
Directed Visual Style
Set the palette, illustration language, typography mood, aspect ratio, and density to suit a classroom, report, campaign, or social post.
Consistent Sections
Define repeated cards, numbered stages, matching icons, and alignment rules so readers can scan the information in the intended order.
Prompt-Based Refinement
Request a shorter headline, clearer label, different emphasis, or simplified composition without rewriting the entire creative brief.
Infographic Formats for Work, Learning, and Content
Match the format to the communication task, then keep the facts concise enough for a single visual to explain well.
Process Infographics
Explain workflows, tutorials, customer journeys, recipes, and operating procedures as numbered steps with a visible direction.
Flowcharts and Diagrams
Map decisions, systems, causes, dependencies, cycles, and conceptual relationships with connected nodes and concise labels.
Knowledge Cards
Summarize a concept, lesson, framework, or research takeaway with diagrams, callouts, and classroom-friendly visual cues.
Statistical Summaries
Organize a limited set of verified numbers into metric cards, simple charts, annotated comparisons, and report-ready highlights.
Comparison Graphics
Place products, methods, choices, or before-and-after states side by side with parallel categories and balanced emphasis.
Timelines and Roadmaps
Show milestones, historical events, launch plans, or project phases in chronological order with dates and stage markers.
Nano Banana Infographic Generator FAQ
Answers about prompts, text accuracy, data, formats, editing, and responsible publishing.
Can Nano Banana Pro generate infographics?
Yes. Nano Banana Pro can combine in-image text, illustration, layout, and visual hierarchy to create infographics from a written brief. Results improve when you provide exact content, a specific format, a reading order, and firm constraints on extra text.
What should a Nano Banana infographic prompt include?
Include the infographic type, audience, aspect ratio, exact title and labels, verified facts or values, section order, visual style, palette, and exclusions. Quote required wording and specify that no additional text should appear.
How do I make text more readable?
Use short labels, limit the number of sections, request large typography and generous spacing, and avoid paragraphs inside the image. State the final aspect ratio and inspect the result at the size where people will actually read it.
Can I create an infographic from data?
Yes, for concise datasets that you provide. Keep categories, values, units, and time periods explicit. Always compare the generated chart and labels with the source because an image model can miscopy numbers or draw a misleading scale.
Which infographic formats can I generate?
You can prompt for process graphics, flowcharts, timelines, comparisons, knowledge cards, statistical summaries, educational diagrams, checklists, funnels, and visual frameworks. Choose one dominant structure per image for better clarity.
Can I match an existing brand style?
Describe approved colors, visual tone, typography characteristics, illustration style, and layout rules. You may also upload references you have permission to use, but avoid asking the model to copy protected artwork or another brand's distinctive design exactly.
Should I verify an AI-generated infographic?
Always. Check every word, number, unit, date, sequence, arrow, chart, symbol, and factual claim before publishing. AI-generated graphics are visual drafts, not verified sources or substitutes for subject-matter review.
Can I use the generated infographic commercially?
Commercial use depends on the applicable model terms, your rights to all inputs, and local law. Confirm permissions for source material, trademarks, data, and references, then review the final image for accuracy and third-party rights.
Turn Your Information into a Nano Banana Infographic
Add a topic, process, or verified dataset and create a clear visual with Nano Banana Pro.